Lab1a: Introduction to Netskope Home Screen (5min)
OVERVIEW
In this lab you will be introduced to the Netskope tenant home dashboard and how to create views of cloud application usage in your Enterprise that will be presented to you when you log in to the Netskope tenant. You will see how to customize the dashboard to display what is important to you, to quickly identify anomalies or risky behavior by users.
Applicable Use Cases
-
Enterprise level view of cloud use
-
Highlight risky activity
Prerequisites
- Your instructor should have given you a POD number: [X]
WALKTHROUGH
In this lab, as an administrator, you will be logging in to the Netskope Cloud Security Platform tenant and analyzing the data to assess the risk of the cloud applications in use.
Step 1 Use your preferred web browser to navigate to the Netskope tenant (during this workshop, everybody uses the same Netskope tenant).
Go to the Netskope tenant ([https://csw2-emea.eu.goskope.com/])
Login to the Netskope tenant using the following credentials,
using your assigned POD number [X] as follow.
Username: csw-admin[x]@netskope.com (for example csw-admin99@netskope.com)
Temporary Pa$$w0rd: Netskope_1-1 (it should be the same for everyone)
If asked, please change your temporary password. You could use the same password that we use over the session also for the other accounts - Netskope_14-04
If login fails, report this to your instructor.
Please read and comply to the Netskope Service Operational Policy.
You can access the Netskope Use Policy from [https://www.netskope.com/terms-of-use] and Privacy Policy from [https://www.netskope.com/privacy-policy] if necessary.
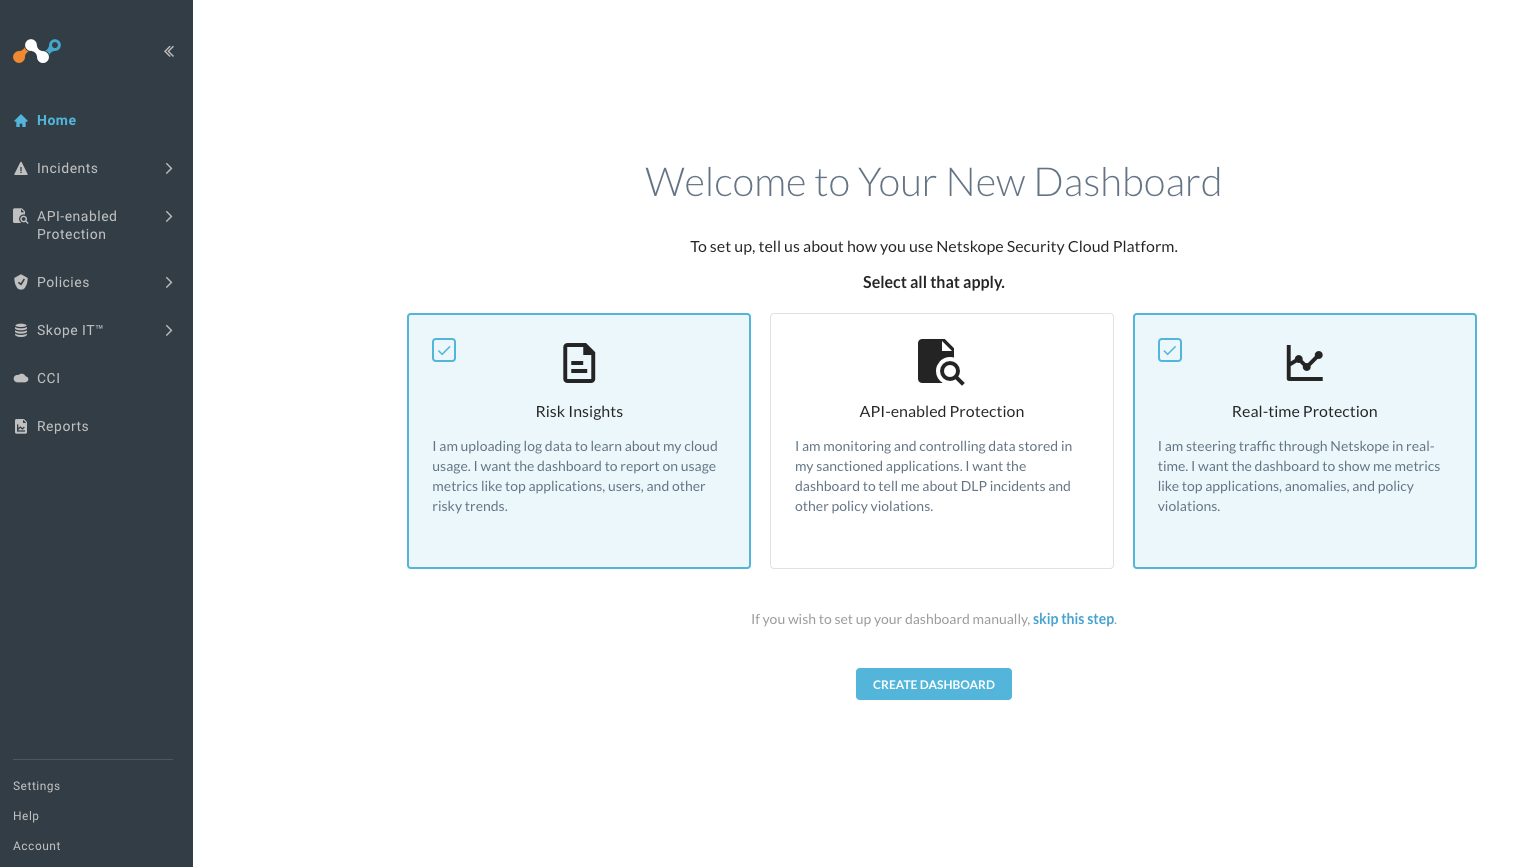
Step 2 If it was your first login, you (could) have the option to create your own dashboard. During this workshop we focus on Risk Insights and Real-Time Protection. If you have interests in Netskope's API-enabled Protection (CASB API, CSPM and more), just let us know... :)
NOTE
Data in this tenant comes from individual browsing -- and includes fictitious data that we have generated for this lab purpose, so expect some log entries to be already present in this lab instance.
Step 3 Make yourself familiar with the Netskope Security Cloud Platform. This is also commonly referred to as the customer tenant, representing the customer's instance of the Netskope Cloud Security Platform.
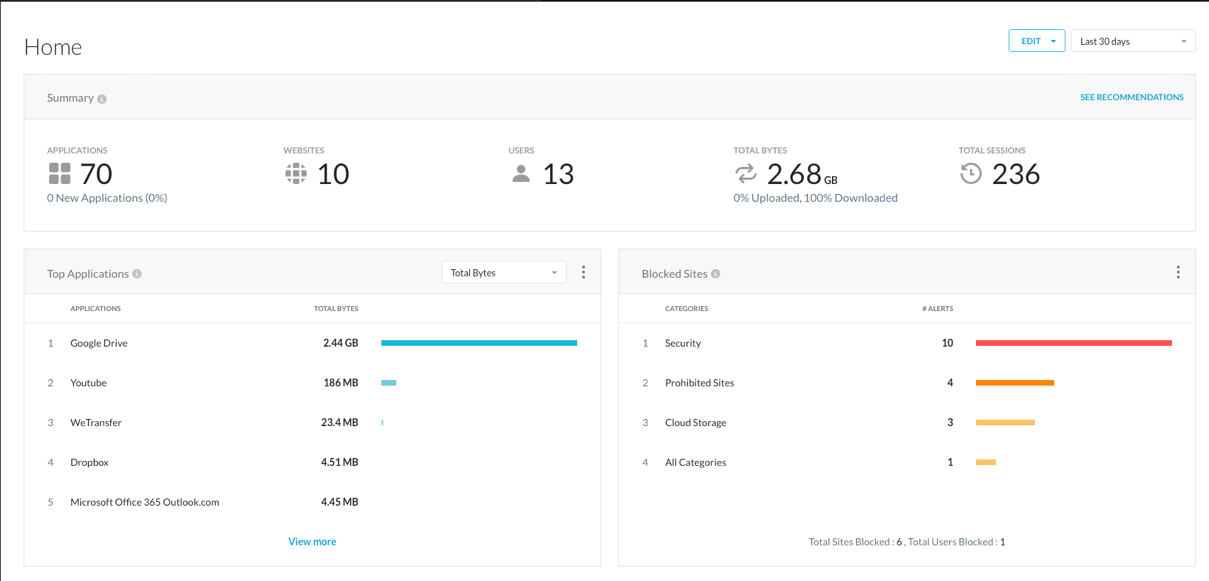
FEEL FREE TO NAVIGATE UI
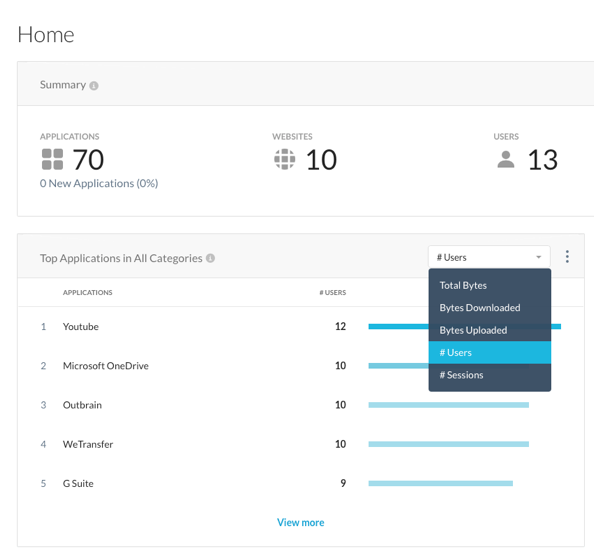
- How many Apps are currently in use?
- How many Users?
- What are the Top Applications by Total Bytes?
Step 4 Switch the time frame from 7 days to 30 days, change the Top Application Widget on this dashboard from "Total Bytes" to "Bytes Uploaded".
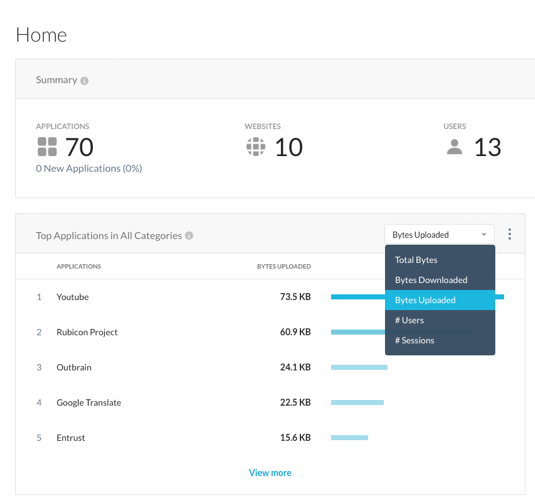
Looking at the "Bytes Uploaded", that is the amount of your corporate data that is going to the cloud.
NOTE
Netskope Next-Gen SWG can prevent unsanctionned exfiltration of data to the cloud. In addition, if data is already in the cloud, Netskope can also enable you to identify it, control it when possible or reduce data movements from cloud to cloud. (We will cover this later)
Step 5 Change the view to "# Users".
- Which are the top applications being used by the greatest number of your enterprise users?
Step 6 Add a new widget for "Top Users" and their Data Usage by clicking the Edit button in the top-right corner and selecting Add Widgets. When presented with the Widget Library, select Users tag and scroll down to the Top Users Widget, click and drag on the Home space (Note, this widget may already be available in your default view, if so remove it from the dashboard - click three vertical dots in the top right corner - and add again).
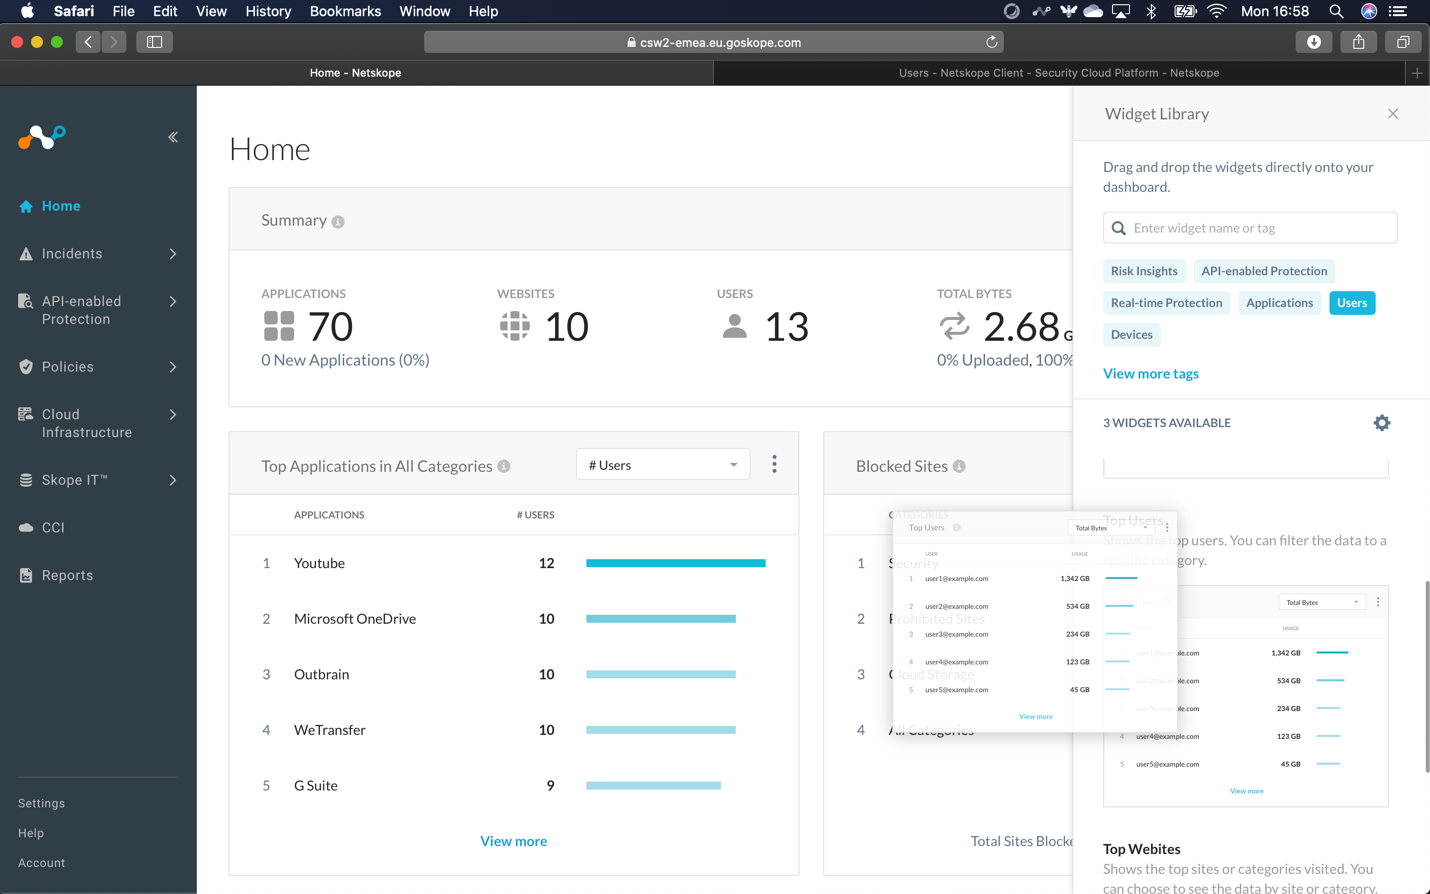
What happens when you click or hover over any of the top usernames? What area does the UI take you to if you click on the username?

Please continue onto the next section.